Timeline of the 2018 Atlantic hurricane season
| Timeline of the 2018 Atlantic hurricane season | |||||||
|---|---|---|---|---|---|---|---|
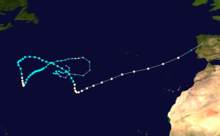
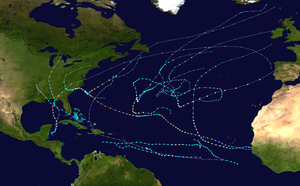 Season summary map | |||||||
| Season boundaries | |||||||
| First system formed | May 25, 2018 | ||||||
| Last system dissipated | October 31, 2018 | ||||||
| Strongest system | |||||||
| Name | Michael | ||||||
| Maximum winds | 160 mph (260 km/h) (1-minute sustained) | ||||||
| Lowest pressure | 919 mbar (hPa; 27.14 inHg) | ||||||
| Longest lasting system | |||||||
| Name | Florence | ||||||
| Duration | 17.75 days | ||||||
| |||||||
| Other years 2016, 2017, 2018, 2019, 2020 | |||||||
The 2018 Atlantic hurricane season was an event in the annual hurricane season in the north Atlantic Ocean. It was an above-average season for tropical cyclones for the third consecutive year. Though the season officially began on June 1, 2018 and ended November 30, 2018, dates adopted by convention and historically describe the period during each year when most tropical cyclones form,[1] it effectively started with the formation of Tropical Storm Alberto on May 25.[2] The season's final storm, Hurricane Oscar, dissipated on October 31.[3]
The year produced sixteen tropical depressions, all but one of which further intensified into named tropical storms. Of the fifteen named storms, eight developed into hurricanes, and two further intensified into major hurricanes, which are rated Category 3 or higher on the Saffir–Simpson scale. These two major hurricanes contributed to a majority of the season's severe destruction and loss of life, mainly in the United States.
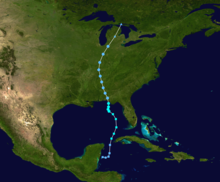
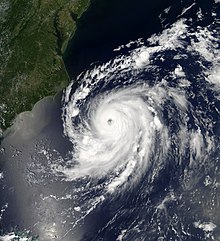
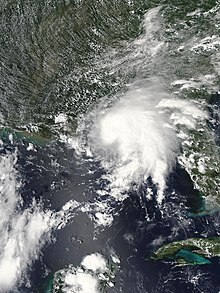
Hurricane Florence formed near Cabo Verde on August 31, steered toward the west-northwest with little exception by a large area of high pressure to its north. The cyclone strengthened amid favorable environmental factors, becoming a Category 4 hurricane with maximum sustained winds of 150 mph (240 km/h) at its peak, but weakening occurred before Florence struck the coastline of North Carolina near Wrightsville Beach on September 14, with winds of 90 mph (140 km/h). Florence dealt a devastating blow to the Carolinas as it meandered across the region. Catastrophic, record-breaking flooding contributed to a majority of the storm's $24 billion in damage and 52 deaths, though significant storm surge along the coastline as well as an inland tornado outbreak caused severe damage as well.[4] In early October, Hurricane Michael formed in the western Caribbean Sea, resulting in significant flooding across Central America and Cuba. However, the majority of the storm's impact was felt in the Florida Panhandle, where Michael struck the coastline near Mexico Beach as a Category 5 hurricane, with winds of 160 mph (260 km/h). This constituted the first landfall of a Category 5 hurricane in the United States since Hurricane Andrew in 1992, and only the fifth in recorded history, alongside "Labor Day", Camille, and "Okeechobee". In addition, Michael became the third deepest by atmospheric pressure, the fourth strongest by maximum winds, and the latest Category 5 hurricane to strike the United States on record. Michael killed 74 people and caused $25 billion in damage.[5]
This timeline documents tropical cyclone formations, strengthening, weakening, landfalls, extratropical transitions, and dissipations during the season. It includes information that was not released throughout the season, meaning that data from post-storm reviews by the National Hurricane Center, such as a storm that was not initially warned upon, has been included.
By convention, meteorologists use one time zone when issuing forecasts and making observations: Coordinated Universal Time (UTC), and also use the 24-hour clock (where 00:00 = midnight UTC).[6] The National Hurricane Center uses both UTC and the time zone where the center of the tropical cyclone is currently located. The time zones utilized (east to west) prior to 2020 were: Atlantic, Eastern, and Central.[7] In this timeline, all information is listed by UTC first with the respective regional time included in parentheses. Additionally, figures for maximum sustained winds and position estimates are rounded to the nearest 5 units (knots, miles, or kilometers), following the convention used in the National Hurricane Center's products. Direct wind observations are rounded to the nearest whole number. Atmospheric pressures are listed to the nearest millibar and nearest hundredth of an inch of mercury.
Timeline

May
May 25
- 12:00 UTC (7:00 a.m. CDT) at 18°48′N 87°06′W / 18.8°N 87.1°W / 18.8; -87.1 – A subtropical depression develops from an area of low pressure off the east coast of the Yucatán Peninsula in Mexico, about 80 miles (130 km) east-northeast of Chetumal, Quintana Roo.[2]
May 26
- 18:00 UTC (1:00 a.m. CDT) at 22°36′N 85°18′W / 22.6°N 85.3°W / 22.6; -85.3 – The subtropical depression intensifies into Subtropical Storm Alberto roughly 60 miles (97 km) north-northwest of the western tip of Cuba.[2]
May 28
- 00:00 UTC (7:00 p.m. CDT May 27) at 28°12′N 85°48′W / 28.2°N 85.8°W / 28.2; -85.8 – Subtropical Storm Alberto transitions to a tropical storm and concurrently attains maximum sustained winds of 65 mph (105 km/h) approximately 115 mi (185 km) south-southwest of Apalachicola, Florida.[2]
- 06:00 UTC (1:00 a.m. CDT) at 28°36′N 86°00′W / 28.6°N 86.0°W / 28.6; -86.0 – Tropical Storm Alberto attains its minimum atmospheric pressure of 990 mbar (hPa; 29.24 inHg) about 100 miles (160 km) southwest of Apalachicola, Florida.[2]
- 21:00 UTC (4:00 p.m. CDT) at 30°18′N 86°00′W / 30.3°N 86.0°W / 30.3; -86.0 – Tropical Storm Alberto makes landfall near the Bay County–Walton County, Florida line, with winds of 45 mph (72 km/h).[2]
May 29
- 00:00 UTC (7:00 p.m. CDT May 28) at 30°54′N 86°06′W / 30.9°N 86.1°W / 30.9; -86.1 – Tropical Storm Alberto weakens to a tropical depression roughly 45 miles (72 km) southwest of Dothan, Alabama.[2]
May 31
- 06:00 UTC (1:00 a.m. CDT) at 43°30′N 84°36′W / 43.5°N 84.6°W / 43.5; -84.6 – Tropical Depression Alberto degenerates to a non-convective remnant area of low pressure approximately 30 miles (48 km) west of Saginaw, Michigan.[2]
June
June 1
- The 2018 Atlantic hurricane season officially begins.[1]
- No tropical cyclones form in the Atlantic Ocean during the month of June.
July
July 4
- 12:00 UTC (8:00 a.m. AST) at 10°00′N 34°54′W / 10.0°N 34.9°W / 10.0; -34.9 – Tropical Depression Two develops from an area of low pressure about 1,495 miles (2,406 km) west-southwest of Cabo Verde.[8]

July 5
- 00:00 UTC (8:00 p.m. AST July 4) at 10°06′N 38°00′W / 10.1°N 38.0°W / 10.1; -38.0 – Tropical Depression Two intensifies into Tropical Storm Beryl roughly 1,465 miles (2,358 km) east-southeast of Barbados.[8]
July 6
- 06:00 UTC (2:00 a.m. AST) at 10°30′N 44°36′W / 10.5°N 44.6°W / 10.5; -44.6 – Tropical Storm Beryl rapidly intensifies into a Category 1 hurricane, simultaneously attaining its peak intensity with winds of 80 mph (130 km/h) and a pressure of 991 mbar (991 hPa; 29.3 inHg), approximately 1,020 miles (1,640 km) southeast of Barbados.[8]
- 12:00 UTC (8:00 a.m. EDT) at 31°30′N 73°06′W / 31.5°N 73.1°W / 31.5; -73.1 – Tropical Depression Three forms about 345 miles (555 km) south-southeast of Cape Hatteras, North Carolina.[9]
July 7
- 12:00 UTC (8:00 a.m. AST) at 11°42′N 50°24′W / 11.7°N 50.4°W / 11.7; -50.4 – Hurricane Beryl weakens to a tropical storm roughly 615 miles (990 km) east-southeast of Barbados.[8]
July 8
- 06:00 UTC (2:00 a.m. EDT) at 33°06′N 75°24′W / 33.1°N 75.4°W / 33.1; -75.4 – Tropical Depression Three intensifies into Tropical Storm Chris approximately 150 miles (240 km) south-southeast of Cape Hatteras, North Carolina.[9]
- 12:00 UTC (8:00 a.m. AST) at 14°06′N 56°54′W / 14.1°N 56.9°W / 14.1; -56.9 – Tropical Storm Beryl degenerates to a tropical wave about 180 miles (290 km) northeast of Barbados.[8]
July 10
- 12:00 UTC (8:00 a.m. EDT) at 32°54′N 73°30′W / 32.9°N 73.5°W / 32.9; -73.5 – Tropical Storm Chris intensifies into a Category 1 hurricane roughly 200 miles (320 km) southeast of Cape Hatteras, North Carolina.[9]
July 11
- 00:00 UTC (8:00 p.m. EDT July 10) at 33°54′N 71°54′W / 33.9°N 71.9°W / 33.9; -71.9 – Hurricane Chris rapidly intensifies into a Category 2 hurricane and simultaneously attains its peak intensity with winds of 105 mph (169 km/h) and a pressure of 969 mbar (969 hPa; 28.6 inHg) approximately 240 miles (390 km) east-southeast of Cape Hatteras, North Carolina.[9]
- 18:00 UTC (2:00 p.m. AST) at 37°00′N 66°48′W / 37.0°N 66.8°W / 37.0; -66.8 – Hurricane Chris weakens to a Category 1 hurricane about 340 miles (550 km) northwest of Bermuda.[9]
July 12
- 12:00 UTC (8:00 a.m. AST) at 43°18′N 59°12′W / 43.3°N 59.2°W / 43.3; -59.2 – Hurricane Chris weakens to a tropical storm roughly 280 miles (450 km) southwest of Saint-Pierre, Saint Pierre and Miquelon.[9]
- 18:00 UTC (2:00 p.m. AST) at 45°42′N 56°24′W / 45.7°N 56.4°W / 45.7; -56.4 – Tropical Storm Chris transitions into an extratropical cyclone approximately 75 miles (121 km) south of Saint-Pierre, Saint Pierre and Miquelon.[9]
July 14
- 12:00 UTC (8:00 a.m. AST) at 35°36′N 66°12′W / 35.6°N 66.2°W / 35.6; -66.2 – The remnants of Beryl regenerate into a subtropical storm about 245 miles (394 km) northwest of Bermuda.[8]
July 16
- 00:00 UTC (8:00 p.m. AST July 15) at 38°18′N 63°06′W / 38.3°N 63.1°W / 38.3; -63.1 – Subtropical Storm Beryl degenerates to a remnant low roughly 430 miles (690 km) north of Bermuda.[8]
August

August 7
- 06:00 UTC (2:00 a.m. AST) at 36°00′N 47°36′W / 36.0°N 47.6°W / 36.0; -47.6 – Subtropical Storm Debby develops approximately 920 miles (1,480 km) west of the westernmost Azores.[10]
August 8
- 00:00 UTC (8:00 p.m. AST August 7) at 39°42′N 49°12′W / 39.7°N 49.2°W / 39.7; -49.2 – Subtropical Storm Debby transitions into a tropical storm about 960 miles (1,540 km) west of the westernmost Azores.[10]
August 9
- 00:00 UTC (8:00 p.m. AST August 8) at 42°24′N 47°12′W / 42.4°N 47.2°W / 42.4; -47.2 – Tropical Storm Debby attains its peak intensity with winds of 50 mph (80 km/h) and a pressure of 998 mbar (998 hPa; 29.5 inHg) roughly 420 miles (680 km) southeast of Cape Race, Newfoundland.[10]
- 18:00 UTC (2:00 p.m. AST) at 45°06′N 42°00′W / 45.1°N 42.0°W / 45.1; -42.0 – Tropical Storm Debby degenerates to a remnant low approximately 545 miles (877 km) east-southeast of Cape Race, Newfoundland.[10]
August 15
- 06:00 UTC (2:00 a.m. AST) at 37°24′N 45°42′W / 37.4°N 45.7°W / 37.4; -45.7 – Subtropical Depression Five develops about 745 miles (1,199 km) southeast of Cape Race, Newfoundland.[11]
- 12:00 UTC (8:00 a.m. AST) at 37°48′N 45°54′W / 37.8°N 45.9°W / 37.8; -45.9 – Subtropical Depression Five intensifies into Subtropical Storm Ernesto roughly 710 miles (1,140 km) southeast of Cape Race, Newfoundland.[11]

August 16
- 12:00 UTC (8:00 a.m. AST) at 41°30′N 43°48′W / 41.5°N 43.8°W / 41.5; -43.8 – Subtropical Storm Ernesto attains peak winds of 45 mph (72 km/h) approximately 585 miles (941 km) southeast of Cape Race, Newfoundland.[11]
- 18:00 UTC (2:00 p.m. AST) at 42°24′N 42°06′W / 42.4°N 42.1°W / 42.4; -42.1 – Subtropical Storm Ernesto transitions into a tropical storm about 615 miles (990 km) southeast of Cape Race, Newfoundland.[11]
August 17
- 18:00 UTC (2:00 p.m. AST) at 48°18′N 31°48′W / 48.3°N 31.8°W / 48.3; -31.8 – Tropical Storm Ernesto attains a minimum pressure of 1,003 mbar (1,003 hPa; 29.6 inHg) roughly 1,000 miles (1,600 km) east-northeast of Cape Race, Newfoundland.[11]
August 18
- 00:00 UTC (8:00 p.m. AST August 17) at 49°48′N 27°42′W / 49.8°N 27.7°W / 49.8; -27.7 – Tropical Storm Ernesto degenerates to a remnant low approximately 805 miles (1,296 km) north-northeast of the Azores.[11]
August 31
- 18:00 UTC (2:00 p.m. AST) at 13°48′N 23°48′W / 13.8°N 23.8°W / 13.8; -23.8& – Tropical Depression Six develops about 105 miles (169 km) southeast of Santiago, Cabo Verde.[4]
September
September 1
- 06:00 UTC (2:00 a.m. AST) at 14°18′N 26°06′W / 14.3°N 26.1°W / 14.3; -26.1 – Tropical Depression Six intensifies into Tropical Storm Florence roughly 125 miles (201 km) west-southwest of the southernmost Cabo Verde archipelago.[4]
September 3
- 06:00 UTC (2:00 a.m. EDT) at 24°12′N 79°24′W / 24.2°N 79.4°W / 24.2; -79.4 – Tropical Depression Seven develops approximately 90 miles (140 km) southeast of Key Largo, Florida.[12]
- 09:00 UTC (5:00 a.m. EDT) at 24°36′N 80°00′W / 24.6°N 80.0°W / 24.6; -80.0 – Tropical Depression Seven intensifies into Tropical Storm Gordon about 40 miles (64 km) southeast of Tavernier, Florida.[12]
- 11:15 UTC (7:15 a.m. EDT) at 25°00′N 80°30′W / 25.0°N 80.5°W / 25.0; -80.5 – Tropical Storm Gordon makes its first landfall near Tavernier, Florida, with winds of 50 mph (80 km/h).[12]
September 4
- 12:00 UTC (8:00 a.m. AST) at 18°42′N 40°12′W / 18.7°N 40.2°W / 18.7; -40.2 – Tropical Storm Florence intensifies into a Category 1 hurricane roughly 1,380 miles (2,220 km) east-northeast of the Lesser Antilles.[4]
September 5
- 00:00 UTC (8:00 p.m. AST September 4) at 20°24′N 43°24′W / 20.4°N 43.4°W / 20.4; -43.4 – Hurricane Florence intensifies into a Category 2 hurricane approximately 1,190 miles (1,920 km) east-northeast of the Lesser Antilles.[4]
- 03:15 UTC (10:15 p.m. CDT September 4) at 30°24′N 88°30′W / 30.4°N 88.5°W / 30.4; -88.5 – Tropical Storm Gordon attains its peak intensity with winds of 70 mph (110 km/h) and a pressure of 996 mbar (996 hPa; 29.4 inHg), simultaneously making its second and final landfall just west of the Alabama–Mississippi border.[12]
- 12:00 UTC (8:00 a.m. AST) at 21°42′N 45°12′W / 21.7°N 45.2°W / 21.7; -45.2 – Hurricane Florence rapidly intensifies into a Category 3 hurricane about 1,095 miles (1,762 km) northeast of the Lesser Antilles.[4]
- 12:00 UTC (7:00 a.m. CDT) at 31°54′N 89°48′W / 31.9°N 89.8°W / 31.9; -89.8 – Tropical Storm Gordon weakens to a tropical depression roughly 35 miles (56 km) southeast of Jackson, Mississippi.[12]
- 18:00 UTC (2:00 p.m. AST) at 22°24′N 46°12′W / 22.4°N 46.2°W / 22.4; -46.2 – Hurricane Florence rapidly intensifies into a Category 4 hurricane approximately 1,380 miles (2,220 km) east-southeast of Bermuda.[4]
September 6
- 06:00 UTC (2:00 a.m. AST) at 23°48′N 47°36′W / 23.8°N 47.6°W / 23.8; -47.6 – Hurricane Florence weakens to a Category 3 hurricane about 1,190 miles (1,920 km) southeast of Bermuda.[4]
- 12:00 UTC (8:00 a.m. AST) at 24°24′N 48°12′W / 24.4°N 48.2°W / 24.4; -48.2 – Hurricane Florence weakens to a Category 2 hurricane roughly 1,135 miles (1,827 km) southeast of Bermuda.[4]
- 18:00 UTC (2:00 p.m. AST) at 24°48′N 49°00′W / 24.8°N 49.0°W / 24.8; -49.0 – Hurricane Florence weakens to a Category 1 hurricane approximately 1,080 miles (1,740 km) southeast of Bermuda.[4]
- 18:00 UTC (1:00 p.m. CDT) at 34°12′N 91°54′W / 34.2°N 91.9°W / 34.2; -91.9 – Tropical Depression Gordon degenerates to a remnant area of low pressure about 45 miles (72 km) southeast of Little Rock, Arkansas.[12]
September 7
- 00:00 UTC (8:00 p.m. AST September 6) at 25°00′N 49°00′W / 25.0°N 49.0°W / 25.0; -49.0 – Hurricane Florence weakens to a tropical storm roughly 1,045 miles (1,682 km) southeast of Bermuda.[4]
- 12:00 UTC (8:00 a.m. AST) at 13°24′N 16°48′W / 13.4°N 16.8°W / 13.4; -16.8 – Tropical Depression Eight develops approximately 15 miles (24 km) west of Banjul, The Gambia.[13]
- 12:00 UTC (8:00 a.m. AST) at 13°30′N 35°00′W / 13.5°N 35.0°W / 13.5; -35.0 – Tropical Depression Nine develops about 690 miles (1,110 km) west of Cabo Verde.[14]

September 8
- 00:00 UTC (8:00 p.m. AST September 7) at 13°36′N 18°00′W / 13.6°N 18.0°W / 13.6; -18.0 – Tropical Depression Eight intensifies into Tropical Storm Helene roughly 260 miles (420 km) east-southeast of Praia, Cabo Verde.[13]
- 12:00 UTC (8:00 a.m. AST) at 14°24′N 35°48′W / 14.4°N 35.8°W / 14.4; -35.8 – Tropical Depression Nine intensifies into Tropical Storm Isaac approximately 745 miles (1,199 km) west of Cabo Verde.[14]
September 9
- 12:00 UTC (8:00 a.m. AST) at 24°24′N 56°06′W / 24.4°N 56.1°W / 24.4; -56.1 – Tropical Storm Florence re-intensifies into a Category 1 hurricane about 755 miles (1,215 km) south-southeast of Bermuda.[4]
- 18:00 UTC (2:00 p.m. AST) at 13°24′N 25°36′W / 13.4°N 25.6°W / 13.4; -25.6 – Tropical Storm Helene intensifies into a Category 1 hurricane roughly 115 miles (185 km) south-southwest of Brava, Cabo Verde.[13]

September 10
- 00:00 UTC (8:00 p.m. AST September 9) at 14°30′N 41°00′W / 14.5°N 41.0°W / 14.5; -41.0 – Tropical Storm Isaac intensifies into a Category 1 hurricane, attaining its peak intensity with winds of 75 mph (121 km/h) and a pressure of 995 mbar (995 hPa; 29.4 inHg), approximately 1,085 miles (1,746 km) west of Cabo Verde.[14]
- 06:00 UTC (2:00 a.m. AST) at 24°42′N 58°24′W / 24.7°N 58.4°W / 24.7; -58.4 – Hurricane Florence re-intensifies into a Category 2 hurricane about 650 miles (1,050 km) south-southeast of Bermuda.[4]
- 12:00 UTC (8:00 a.m. AST) at 24°54′N 59°30′W / 24.9°N 59.5°W / 24.9; -59.5 – Hurricane Florence re-intensifies into a Category 3 hurricane roughly 600 miles (970 km) south-southeast of Bermuda.[4]
- 12:00 UTC (8:00 a.m. AST) at 14°24′N 29°24′W / 14.4°N 29.4°W / 14.4; -29.4 – Hurricane Helene intensifies into a Category 2 hurricane approximately 395 miles (636 km) west of Praia, Cabo Verde.[13]
- 18:00 UTC (2:00 p.m. AST) at 25°12′N 60°36′W / 25.2°N 60.6°W / 25.2; -60.6 – Hurricane Florence re-intensifies into a Category 4 hurricane about 550 miles (890 km) south-southeast of Bermuda.[4]

September 11
- 00:00 UTC (8:00 p.m. AST September 10) at 15°18′N 32°06′W / 15.3°N 32.1°W / 15.3; -32.1 – Hurricane Helene attains peak winds of 110 mph (180 km/h) roughly 570 miles (920 km) west of Praia, Cabo Verde.[13]
- 00:00 UTC (8:00 p.m. AST September 10) at 14°30′N 46°12′W / 14.5°N 46.2°W / 14.5; -46.2 – Hurricane Isaac weakens to a tropical storm approximately 1,435 miles (2,309 km) west of Cabo Verde.[14]
- 12:00 UTC (8:00 a.m. AST) at 16°12′N 34°00′W / 16.2°N 34.0°W / 16.2; -34.0 – Hurricane Helene attains a minimum pressure of 967 mbar (967 hPa; 28.6 inHg) about 705 miles (1,135 km) west-northwest of Praia, Cabo Verde.[13]
- 18:00 UTC (2:00 p.m. EDT) at 27°12′N 66°24′W / 27.2°N 66.4°W / 27.2; -66.4 – Hurricane Florence attains its peak intensity with winds of 150 mph (240 km/h) and a pressure of 937 mbar (937 hPa; 27.7 inHg) roughly 835 miles (1,344 km) east-southeast of Cape Fear, North Carolina.[4]
September 12
- 06:00 UTC (2:00 a.m. AST) at 18°42′N 35°48′W / 18.7°N 35.8°W / 18.7; -35.8 – Hurricane Helene weakens to a Category 1 hurricane approximately 855 miles (1,376 km) west-northwest of Praia, Cabo Verde.[13]
- 12:00 UTC (8:00 a.m. AST) at 35°48′N 41°30′W / 35.8°N 41.5°W / 35.8; -41.5 – Subtropical Storm Joyce develops about 610 miles (980 km) southwest of the Azores.[15]
- 18:00 UTC (2:00 p.m. EDT) at 30°24′N 71°54′W / 30.4°N 71.9°W / 30.4; -71.9 – Hurricane Florence weakens to a Category 3 hurricane roughly 430 miles (690 km) southeast of Wrightsville Beach, North Carolina.[4]
September 13
- 12:00 UTC (8:00 a.m. EDT) at 33°06′N 75°06′W / 33.1°N 75.1°W / 33.1; -75.1 – Hurricane Florence weakens to a Category 2 hurricane approximately 175 miles (282 km) southeast of Wrightsville Beach, North Carolina.[4]
- 12:00 UTC (8:00 a.m. AST) at 24°06′N 37°24′W / 24.1°N 37.4°W / 24.1; -37.4 – Hurricane Helene weakens to a tropical storm about 1,105 miles (1,778 km) northwest of Praia, Cabo Verde.[13]
September 14
- 00:00 UTC (8:00 p.m. AST September 13) at 33°06′N 44°24′W / 33.1°N 44.4°W / 33.1; -44.4 – Subtropical Storm Joyce transitions into a tropical storm roughly 850 miles (1,370 km) southwest of the Azores.[15]
- 11:15 UTC (7:15 a.m. EDT) at 34°12′N 77°48′W / 34.2°N 77.8°W / 34.2; -77.8 – Hurricane Florence weakens to a Category 1 hurricane while making landfall near Wrightsville Beach, North Carolina, with winds of 90 mph (140 km/h).[4]

September 15
- 00:00 UTC (8:00 p.m. EDT September 14) at 33°54′N 78°48′W / 33.9°N 78.8°W / 33.9; -78.8 – Hurricane Florence weakens to a tropical storm approximately 10 miles (16 km) northwest of North Myrtle Beach, South Carolina.[4]
- 00:00 UTC (8:00 p.m. AST September 14) at 15°24′N 69°00′W / 15.4°N 69.0°W / 15.4; -69.0 – Tropical Storm Isaac weakens to a tropical depression about 215 miles (346 km) south-southeast of Santo Domingo, Dominican Republic.[14]
- 00:00 UTC (8:00 p.m. AST September 14) – Tropical Storm Joyce attains its peak intensity with winds of 50 mph (80 km/h) and a pressure of 995 mbar (995 hPa; 29.4 inHg) roughly 900 miles (1,400 km) south-southwest of the Azores.[15]
- 06:00 UTC (2:00 a.m. AST) – Tropical Depression Isaac dissipates approximately 230 miles (370 km) south-southwest of the southwestern coast of Puerto Rico.[14]
September 16
- 12:00 UTC (8:00 a.m. AST) at 43°06′N 27°06′W / 43.1°N 27.1°W / 43.1; -27.1 – Tropical Storm Helene transitions into an extratropical cyclone about 290 miles (470 km) north of the Azores.[13]
- 12:00 UTC (8:00 a.m. AST) at 34°18′N 35°12′W / 34.3°N 35.2°W / 34.3; -35.2 – Tropical Storm Joyce weakens to a tropical depression roughly 410 miles (660 km) south-southwest of the Azores.[15]
- 18:00 UTC (2:00 p.m. EDT) at 34°06′N 82°06′W / 34.1°N 82.1°W / 34.1; -82.1 – Tropical Storm Florence weakens to a tropical depression approximately 5 miles (8.0 km) south-southeast of Greenwood, South Carolina.[4]
September 17
- 12:00 UTC (8:00 a.m. EDT) at 38°42′N 82°00′W / 38.7°N 82.0°W / 38.7; -82.0 – Tropical Depression Florence transitions into an extratropical cyclone about 30 miles (48 km) northeast of Huntington, West Virginia.[4]
September 19
- 00:00 UTC (8:00 p.m. AST September 18) at 30°24′N 27°54′W / 30.4°N 27.9°W / 30.4; -27.9 – Tropical Depression Joyce degenerates to a remnant area of low pressure roughly 475 miles (764 km) south of the Azores.[15]

September 21
- 18:00 UTC (2:00 p.m. AST) at 12°54′N 52°30′W / 12.9°N 52.5°W / 12.9; -52.5 – Tropical Depression Eleven develops and attains peak winds of 35 mph (56 km/h) approximately 465 miles (748 km) east of Barbados.[16]
September 22
- 00:00 UTC (8:00 p.m. AST) at 13°00′N 53°12′W / 13.0°N 53.2°W / 13.0; -53.2 – Tropical Depression Eleven attains a minimum pressure of 1,007 mbar (1,007 hPa; 29.7 inHg) about 420 miles (680 km) east of Barbados.[16]
- 06:00 UTC (2:00 a.m. AST) at 7°42′N 21°48′W / 7.7°N 21.8°W / 7.7; -21.8 – Tropical Depression Twelve develops roughly 520 miles (840 km) south-southeast of Cabo Verde.[17]
- 12:00 UTC (8:00 a.m. AST) at 8°06′N 22°54′W / 8.1°N 22.9°W / 8.1; -22.9 – Tropical Depression Twelve intensifies into Tropical Storm Kirk approximately 475 miles (764 km) south of Praia, Cabo Verde.[17]
September 23
- 00:00 UTC (8:00 p.m. AST September 22) – Tropical Depression Eleven dissipates about 345 miles (555 km) east of the Lesser Antilles.[16]
- 12:00 UTC (8:00 a.m. AST) at 9°12′N 29°18′W / 9.2°N 29.3°W / 9.2; -29.3 – Tropical Storm Kirk degenerates to a tropical wave roughly 555 miles (893 km) southwest of Praia, Cabo Verde.[17]
- 12:00 UTC (8:00 a.m. AST) at 33°12′N 46°30′W / 33.2°N 46.5°W / 33.2; -46.5 – Subtropical Storm Leslie develops approximately 945 miles (1,521 km) southwest of the Azores.[18]
September 25
- 00:00 UTC (8:00 p.m. AST September 24) at 32°42′N 47°12′W / 32.7°N 47.2°W / 32.7; -47.2 – Subtropical Storm Leslie weakens to a subtropical depression about 1,000 miles (1,600 km) southwest of the Azores.[18]
- 12:00 UTC (8:00 a.m. AST) at 31°42′N 45°12′W / 31.7°N 45.2°W / 31.7; -45.2 – Subtropical Depression Leslie transitions into an extratropical cyclone roughly 940 miles (1,510 km) southwest of the Azores.[18]

September 26
- 00:00 UTC (8:00 p.m. AST September 25) at 11°30′N 50°18′W / 11.5°N 50.3°W / 11.5; -50.3 – The remnants of Kirk regenerate into a tropical storm approximately 520 miles (840 km) east-southeast of Barbados.[17]
- 12:00 UTC (8:00 a.m. AST) at 12°06′N 53°36′W / 12.1°N 53.6°W / 12.1; -53.6& – Tropical Storm Kirk attains peak winds of 65 mph (105 km/h) about 405 miles (652 km) east-southeast of Barbados.[17]
- 18:00 UTC (2:00 p.m. AST) at 12°30′N 55°00′W / 12.5°N 55.0°W / 12.5; -55.0 – Tropical Storm Kirk attains a minimum pressure of 998 mbar (998 hPa; 29.5 inHg) roughly 305 miles (491 km) east-southeast of Barbados.[17]
September 28
- 00:30 UTC (8:30 p.m. AST September 27) at 13°48′N 60°54′W / 13.8°N 60.9°W / 13.8; -60.9 – Tropical Storm Kirk makes landfall on Saint Lucia, with winds of 50 mph (80 km/h).[17]
- 12:00 UTC (8:00 a.m. AST) at 36°24′N 46°24′W / 36.4°N 46.4°W / 36.4; -46.4 – The remnants of Leslie regenerate into a subtropical storm approximately 850 miles (1,370 km) southwest of the Azores.[18]
September 29
- 00:00 UTC (8:00 p.m. AST September 28) – Tropical Storm Kirk degenerates to a tropical wave a few hundred miles south of the United States Virgin Islands.[17]
- 18:00 UTC (2:00 p.m. AST) at 34°18′N 51°18′W / 34.3°N 51.3°W / 34.3; -51.3 – Subtropical Storm Leslie transitions into a tropical storm about 1,160 miles (1,870 km) southwest of the Azores.[18]
October
October 3
- 06:00 UTC (2:00 a.m. AST) at 29°36′N 56°48′W / 29.6°N 56.8°W / 29.6; -56.8 – Tropical Storm Leslie intensifies into a Category 1 hurricane roughly 510 miles (820 km) east-southeast of Bermuda.[18]
October 4
- 18:00 UTC (2:00 p.m. AST) at 32°48′N 57°18′W / 32.8°N 57.3°W / 32.8; -57.3 – Hurricane Leslie weakens to a tropical storm approximately 435 miles (700 km) east of Bermuda.[18]
October 7
- 06:00 UTC (1:00 a.m. CDT) at 18°24′N 86°48′W / 18.4°N 86.8°W / 18.4; -86.8 – Tropical Depression Fourteen develops about 125 miles (201 km) south of Cozumel.[5]
- 12:00 UTC (7:00 a.m. CDT) at 18°48′N 86°24′W / 18.8°N 86.4°W / 18.8; -86.4 – Tropical Depression Fourteen intensifies into Tropical Storm Michael roughly 105 miles (169 km) south-southeast of Cozumel.[5]
October 8
- 12:00 UTC (7:00 a.m. CDT) at 20°54′N 85°06′W / 20.9°N 85.1°W / 20.9; -85.1 – Tropical Storm Michael intensifies into a Category 1 hurricane approximately 65 miles (105 km) south of the western tip of Cuba.[5]
October 9
- 00:00 UTC (7:00 p.m. CDT October 8) at 22°42′N 85°12′W / 22.7°N 85.2°W / 22.7; -85.2 – Hurricane Michael intensifies into a Category 2 hurricane about 250 miles (400 km) southwest of Key West, Florida.[5]
- 06:00 UTC (2:00 a.m. AST) at 10°06′N 29°00′W / 10.1°N 29.0°W / 10.1; -29.0 – Tropical Depression Fifteen develops roughly 495 miles (797 km) southwest of Praia, Cabo Verde.[19]
- 12:00 UTC (8:00 a.m. AST) at 10°24′N 29°36′W / 10.4°N 29.6°W / 10.4; -29.6 – Tropical Depression Fifteen intensifies into Tropical Storm Nadine approximately 515 miles (829 km) southwest of Praia, Cabo Verde.[19]
- 18:00 UTC (1:00 p.m. CDT) at 25°36′N 86°24′W / 25.6°N 86.4°W / 25.6; -86.4 – Hurricane Michael intensifies into a Category 3 hurricane about 295 miles (475 km) southwest of Tampa, Florida.[5]

October 10
- 00:00 UTC (8:00 p.m. AST October 9) at 29°48′N 42°42′W / 29.8°N 42.7°W / 29.8; -42.7 – Tropical Storm Leslie re-intensifies into a Category 1 hurricane roughly 1,320 miles (2,120 km) east of Bermuda.[18]
- 06:00 UTC (2:00 a.m. AST) at 11°48′N 30°54′W / 11.8°N 30.9°W / 11.8; -30.9 – Tropical Storm Nadine attains its peak intensity with winds of 65 mph (105 km/h) and a minimum pressure of 995 mbar (995 hPa; 29.4 inHg) approximately 540 miles (870 km) southwest of Praia, Cabo Verde.[19]
- 06:00 UTC (1:00 a.m. CDT) at 27°42′N 86°36′W / 27.7°N 86.6°W / 27.7; -86.6 – Hurricane Michael intensifies into a Category 4 hurricane about 235 miles (378 km) southwest of Tallahassee, Florida.[5]
- 17:30 UTC (12:30 p.m. CDT) at 30°00′N 85°30′W / 30.0°N 85.5°W / 30.0; -85.5 – Hurricane Michael intensifies into a Category 5 hurricane and simultaneously attains its peak intensity with maximum winds of 160 mph (260 km/h) and a minimum pressure of 919 mbar (919 hPa; 27.1 inHg). At this time, the powerful cyclone also makes landfall near Tyndall Air Force Base in Florida, becoming the fourth strongest, third deepest, and latest Category 5 hurricane to strike the United States in recorded history.[5]
- 18:00 UTC (1:00 p.m. CDT) at 30°12′N 85°24′W / 30.2°N 85.4°W / 30.2; -85.4 – Hurricane Michael weakens to a Category 4 hurricane roughly 15 miles (24 km) northeast of Panama City, Florida.[5]

October 11
- 00:00 UTC (8:00 p.m. EDT October 10) at 31°30′N 84°30′W / 31.5°N 84.5°W / 31.5; -84.5 – Hurricane Michael rapidly weakens to a Category 1 hurricane approximately 20 miles (32 km) west-southwest of Albany, Georgia.[5]
- 06:00 UTC (2:00 a.m. EDT) at 32°48′N 83°12′W / 32.8°N 83.2°W / 32.8; -83.2 – Hurricane Michael weakens to a tropical storm about 25 miles (40 km) east of Macon, Georgia.[5]
October 12
- 00:00 UTC (8:00 p.m. AST October 11) at 30°24′N 35°12′W / 30.4°N 35.2°W / 30.4; -35.2 – Hurricane Leslie attains its peak intensity with maximum winds of 90 mph (140 km/h) and a minimum pressure of 968 mbar (968 hPa; 28.6 inHg) roughly 670 miles (1,080 km) southwest of the Azores.[18]
- 00:00 UTC (8:00 p.m. EDT October 11) at 36°30′N 77°42′W / 36.5°N 77.7°W / 36.5; -77.7 – Tropical Storm Michael transitions into an extratropical cyclone approximately 15 miles (24 km) southwest of Emporia, Virginia.[5]
- 18:00 UTC (2:00 p.m. AST) at 16°12′N 37°00′W / 16.2°N 37.0°W / 16.2; -37.0 – Tropical Storm Nadine weakens to a tropical depression about 900 miles (1,400 km) west of Praia, Cabo Verde.[19]
October 13
- 00:00 UTC (8:00 p.m. AST October 12) – Tropical Depression Nadine degenerates to a tropical wave roughly 865 miles (1,392 km) west of Cabo Verde.[19]
- 18:00 UTC (2:00 p.m. AST) at 39°18′N 10°30′W / 39.3°N 10.5°W / 39.3; -10.5 – Hurricane Leslie transitions into an extratropical cyclone approximately 85 miles (137 km) west-northwest of Lisbon, Portugal.[18]
October 26
- 18:00 UTC (2:00 p.m. AST) at 25°24′N 45°18′W / 25.4°N 45.3°W / 25.4; -45.3 – Subtropical Storm Oscar develops about 1,260 miles (2,030 km) south-southwest of the Azores.[3]
October 27
- 18:00 UTC (2:00 p.m. AST) at 27°06′N 49°54′W / 27.1°N 49.9°W / 27.1; -49.9 – Subtropical Storm Oscar transitions into a tropical storm roughly 1,365 miles (2,197 km) southwest of the Azores.[3]

October 28
- 18:00 UTC (2:00 p.m. AST) at 25°42′N 54°48′W / 25.7°N 54.8°W / 25.7; -54.8 – Tropical Storm Oscar intensifies into a Category 1 hurricane approximately 1,655 miles (2,663 km) southwest of the Azores.[3]
October 29
- 18:00 UTC (2:00 p.m. AST) at 26°12′N 58°30′W / 26.2°N 58.5°W / 26.2; -58.5 – Hurricane Oscar intensifies into a Category 2 hurricane about 565 miles (909 km) southeast of Bermuda.[3]
October 30
- 00:00 UTC (8:00 p.m. AST October 29) at 27°00′N 58°30′W / 27.0°N 58.5°W / 27.0; -58.5 – Hurricane Oscar attains its peak intensity with winds of 110 mph (180 km/h) and a minimum pressure of 966 mbar (966 hPa; 28.5 inHg) roughly 520 miles (840 km) southeast of Bermuda.[3]
- 18:00 UTC (2:00 p.m. AST) at 30°18′N 57°18′W / 30.3°N 57.3°W / 30.3; -57.3 – Hurricane Oscar weakens to a Category 1 hurricane approximately 465 miles (748 km) east-southeast of Bermuda.[3]
October 31
- 18:00 UTC (2:00 p.m. AST) at 38°00′N 50°30′W / 38.0°N 50.5°W / 38.0; -50.5 – Hurricane Oscar transitions into an extratropical cyclone about 905 miles (1,456 km) northeast of Bermuda.[3]
November
- No tropical cyclones form in the Atlantic Ocean during the month of November.
November 30
- The 2018 Atlantic hurricane season officially ends.[1]
See also
References
- ^ a b c Dorst, Neal (June 1, 2018). "Hurricane Season Information". Frequently Asked Questions About Hurricanes. Miami, Florida: NOAA Atlantic Oceanographic and Meteorological Laboratory. Retrieved June 29, 2020.
- ^ a b c d e f g h Berg, Robbie (October 18, 2018). Tropical Cyclone Report: Tropical Storm Alberto (PDF) (Report). Miami, Florida: National Hurricane Center. Retrieved April 19, 2019.
- ^ a b c d e f g h Brown, Daniel (February 19, 2019). Tropical Cyclone Report: Hurricane Oscar (PDF) (Report). Miami, Florida: National Hurricane Center. Retrieved May 5, 2019.
- ^ a b c d e f g h i j k l m n o p q r s t u v Stewart, Stacy; Berg, Robbie (May 3, 2019). Tropical Cyclone Report: Hurricane Florence (PDF) (Report). Miami, Florida: National Hurricane Center. Retrieved May 3, 2019.
- ^ a b c d e f g h i j k l Beven, John; Berg, Robbie; Hagen, Andrew (April 19, 2019). Tropical Cyclone Report: Hurricane Michael (PDF) (Report). Miami, Florida: National Hurricane Center. Retrieved May 5, 2019.
- ^ "Understanding the Date/Time Stamps". Miami, Florida: NOAA National Hurricane Center. Retrieved July 10, 2020.
- ^ "Update on National Hurricane Center Products and Services for 2020" (PDF). Miami, Florida: National Hurricane Center. April 20, 2020. Retrieved May 17, 2020.
- ^ a b c d e f g Avila, Lixion; Fritz, Cody (September 20, 2018). Tropical Cyclone Report: Hurricane Beryl (PDF) (Report). Miami, Florida: National Hurricane Center. Retrieved April 21, 2019.
- ^ a b c d e f g Blake, Eric (December 14, 2018). Tropical Cyclone Report: Hurricane Chris (PDF) (Report). Miami, Florida: National Hurricane Center. Retrieved April 21, 2019.
- ^ a b c d Pasch, Richard (March 28, 2019). Tropical Cyclone Report: Tropical Storm Debby (PDF) (Report). Miami, Florida: National Hurricane Center. Retrieved April 22, 2019.
- ^ a b c d e f Beven, John (April 2, 2019). Tropical Cyclone Report: Tropical Storm Ernesto (PDF) (Report). Miami, Florida: National Hurricane Center. Retrieved April 22, 2019.
- ^ a b c d e f Brown, Daniel; Latto, Andrew; Berg, Robbie (February 19, 2019). Tropical Cyclone Report: Tropical Storm Gordon (PDF) (Report). Miami, Florida: National Hurricane Center. Retrieved May 5, 2019.
- ^ a b c d e f g h i Cangialosi, John (December 13, 2018). Tropical Cyclone Report: Hurricane Helene (PDF) (Report). Miami, Florida: National Hurricane Center. Retrieved May 5, 2019.
- ^ a b c d e f Zelinsky, David (January 30, 2019). Tropical Cyclone Report: Hurricane Isaac (PDF) (Report). Miami, Florida: National Hurricane Center. Retrieved May 5, 2019.
- ^ a b c d e Berg, Robbie (January 30, 2019). Tropical Cyclone Report: Tropical Storm Joyce (PDF) (Report). Miami, Florida: National Hurricane Center. Retrieved May 5, 2019.
- ^ a b c Avila, Lixion (November 9, 2018). Tropical Cyclone Report: Tropical Depression Eleven (PDF) (Report). Miami, Florida: National Hurricane Center. Retrieved May 5, 2019.
- ^ a b c d e f g h Blake, Eric (January 29, 2019). Tropical Cyclone Report: Tropical Storm Kirk (PDF) (Report). Miami, Florida: National Hurricane Center. Retrieved May 5, 2019.
- ^ a b c d e f g h i j Pasch, Richard; Roberts, David (March 29, 2019). Tropical Cyclone Report: Hurricane Leslie (PDF) (Report). Miami, Florida: National Hurricane Center. Retrieved May 5, 2019.
- ^ a b c d e Stewart, Stacy (March 22, 2019). Tropical Cyclone Report: Tropical Storm Nadine (PDF) (Report). Miami, Florida: National Hurricane Center. Retrieved May 5, 2019.
External links
Wikimedia Commons has media related to 2018 Atlantic hurricane season.
- 2018 Tropical Cyclone Advisory Archive, National Hurricane Center and Central Pacific Hurricane Center
Portals:
 Tropical cyclones
 Weather


